With the release of the 2020 feedback report detailing the 2.2% maximum possible payment adjustment and the release of the 2022 Proposed Rule, MIPS participants find themselves wrestling with lingering disappointment from participation in the program in previous years, and resistance to the idea that MIPS will be financially rewarding and challenging, in terms of reporting requirements, in 2021 and beyond.
This is the second in a series of blog posts on the 2020 payment adjustment and the 2022 Proposed Rule, that will address this sense of disappointment and show how the future of MIPS will contain much more rigorous program requirements and create greater financial rewards. To see financial and program success, you will need to be prepared to meet the new challenges. We have the guidance you need to succeed in 2021 and beyond. 
This blog will review current and upcoming challenges for MIPS reporting and how these challenges make it increasingly difficult to earn the same score and associated payment adjustments as in prior years, even for practices accustomed to earning scores above the exceptional performance threshold. Today, we will focus on changes to the Quality Performance Category.
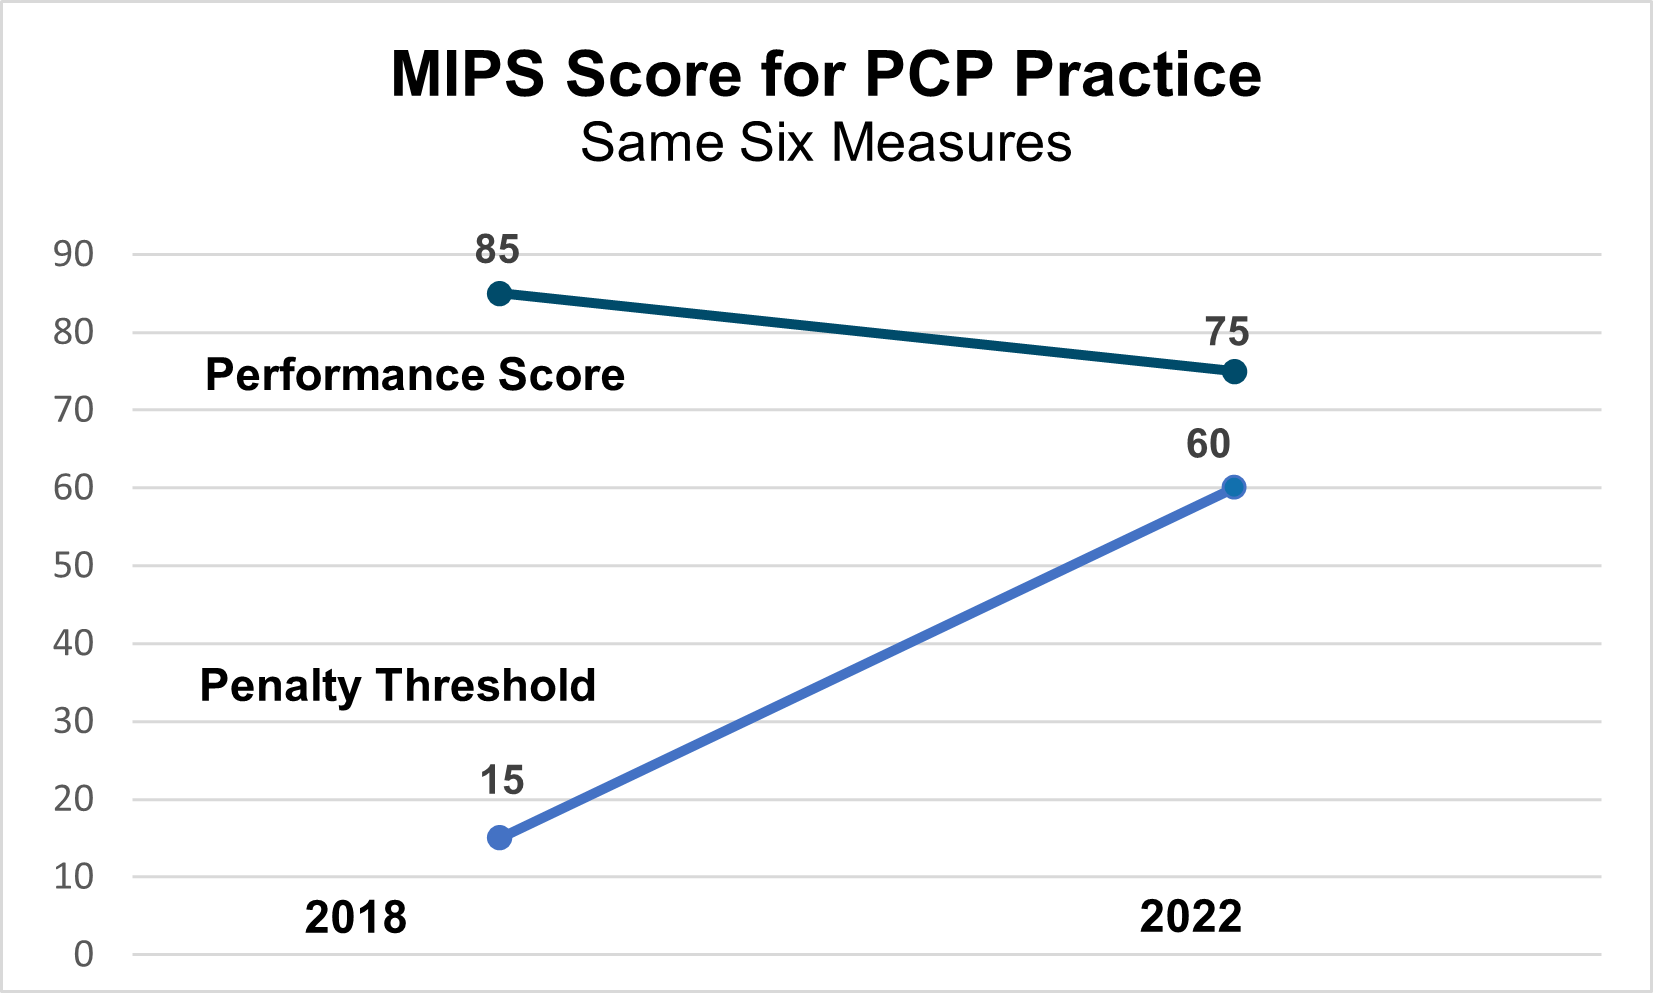
In the chart below, consider the performance category and final MIPS score data from one of our primary care practices in 2018. The practice earned an overall score of 85 points (exceptional performance).
2018 MIPS Score for PCP Practice |
|||
|
Performance Category |
Performance Category Points |
Performance Category Weight |
MIPS Score (2018) |
|
Quality |
60/60 |
50% |
50 |
|
PI |
50/100 |
25% |
13 |
|
IA |
20/20 |
15% |
15 |
|
Cost |
7/10 |
10% |
7 |
|
Total MIPS Score |
|
|
85 |
In 2022, if this practice selects the same Quality measures and Improvement Activities, and earns the same performance points in each category, these percentages are projected to yield a lower score of 78%, which only narrowly meets the increased performance threshold of 75 points to avoid —just barely—the MIPS payment adjustment. Note, in this example, we are comparing the results from the same measures and activities, with the practice earning approximately the same Quality and IA points for reporting the same measures and activities in 2018 and 2022 (projected results for 2022).
2022 MIPS Score for PCP Practice |
|||
|
Performance Category |
Performance Category Points |
Performance Category Weight |
MIPS Score (2022) |
|
Quality |
60/60 |
30% |
30 |
|
PI |
50/100 |
25% |
13 |
|
IA |
20/20 |
15% |
15 |
|
Cost |
20/30 |
20% |
20 |
|
Total MIPS Score |
|
|
78 |

As you can see from the data above, it is the changes in performance category weight, rather than a substantive change in points earned in each category, that is driving the overall change in MIPS final score.
Now that we’ve established a practice that maintains roughly the same performance over multiple performance years will earn a much lower MIPS score in 2022 (approximately 8 points lower in our example above), let’s take a closer look at some of the big picture factors that influenced this change.
Changes in Quality and Cost Performance Category Weights
Starting in 2022, with 100% performance in the three reported performance categories, clinicians cannot be certain that they’ve met the 75% threshold to avoid the payment adjustment without accurately estimating their Cost score, which will be weighted at 30% in 2022. Clinicians can only earn 70% of the MIPS final score in reported categories. In short, not only is it harder to earn points for the Quality performance category, the points earned will make less of an impact on your total MIPS score.
Additionally, the increased emphasis on Cost makes it more challenging to estimate your MIPS Score. Cost is calculated by Medicare Part B claims and clinicians do not have access to Cost scoring data until Performance Feedback is released. Furthermore, in 2021 the Cost performance category was reweighted to 0%, so 2020 Cost data will not be available in 2020 Feedback Reports. Clinicians will not be able to utilize that data to make changes or improvements for the 2021 reporting period. The most recent Cost data available will be from 2019 or, for some covid-19 impacted organizations, 2018.
The change to performance category weights, the increased performance threshold of 75 points, and changes in Quality and Cost reweighting create a big impact. On top of that, there are significant changes to Quality measures and bonus points that create a further challenge in scoring well. This is even true for clinicians with excellent Quality scores who are largely unaffected by the slew of changes to Quality measures that makes earning a high Quality score more difficult, as we have seen above in our example of how a primary care practice.
Impacts of Quality Performance Category Measure Reporting Challenges on Specific Specialties
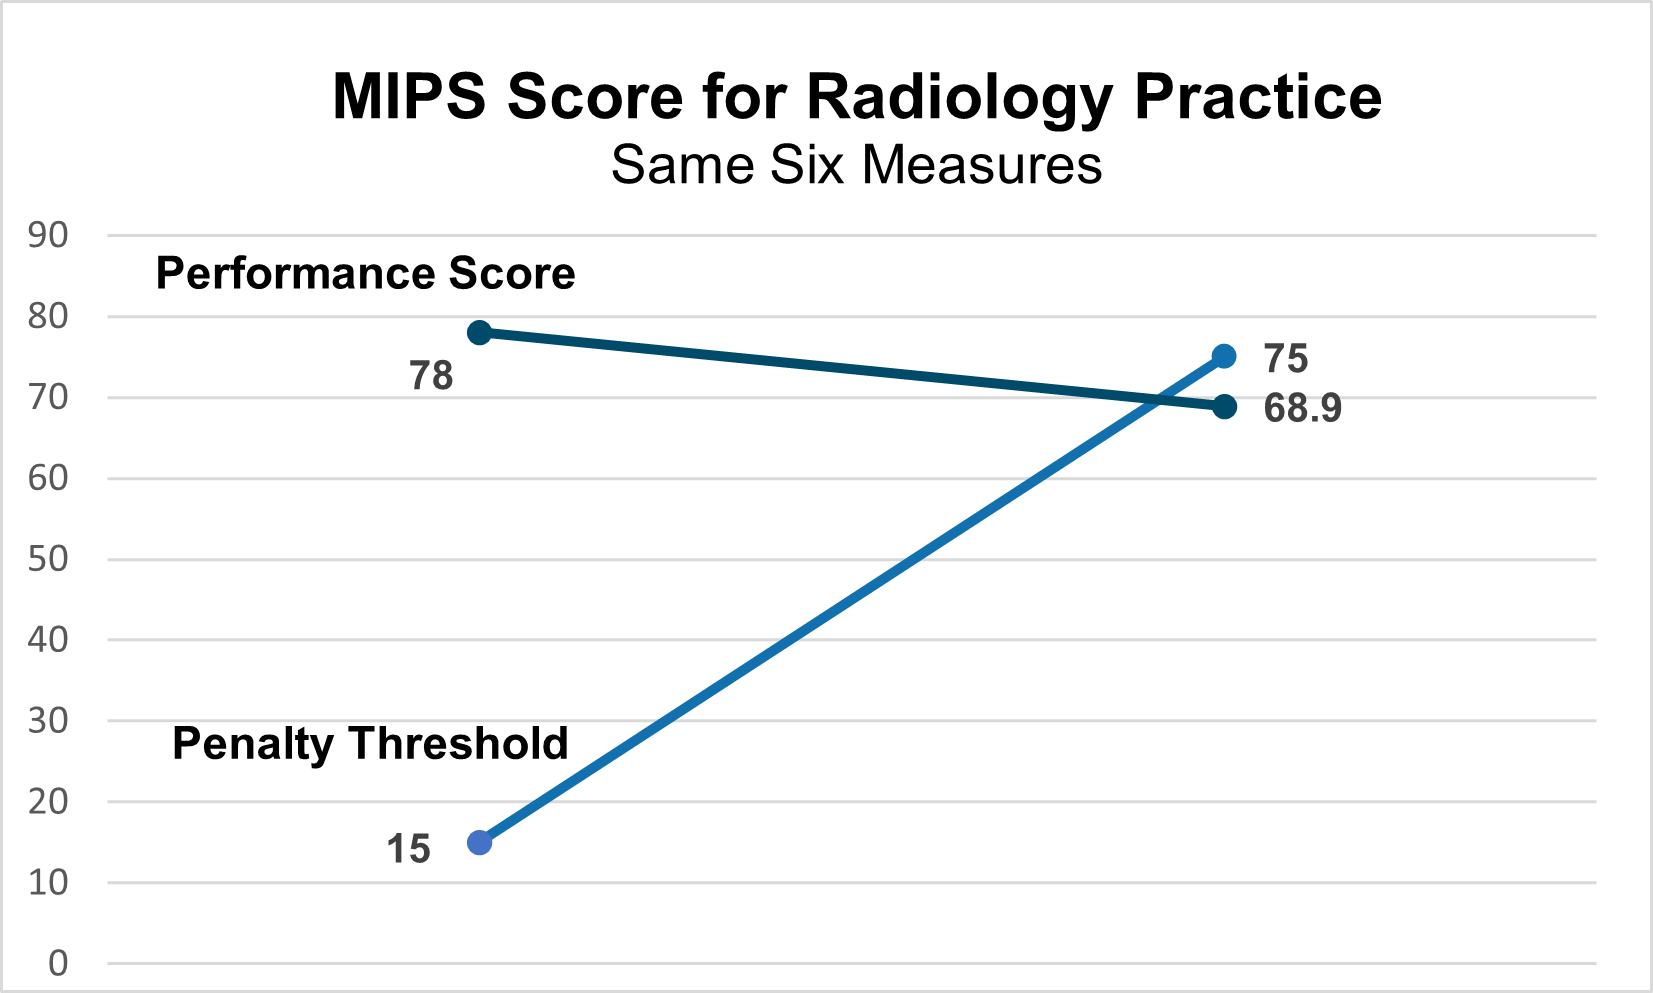
Some specialties are likely to experience more challenges in meeting the increased performance threshold. Consider the following radiology practice that reported six measures in 2018. The tables below illustrate the potential impact of changes between 2018 and 2022, primarily due to the proposed changes in scoring for the Quality performance category and the retiring and removal of highly topped-out Quality measures.

|
MIPS Category |
2018 Performance Category Points |
2018 Performance Category Weight |
2018 Composite Score |
|
Quality |
44/60 |
75% |
55 |
|
IA |
15/15 |
15% |
15 |
|
PI |
0/25 |
0% |
0 |
|
Cost |
8/10 |
10% |
8 |
|
Total MIPS Score |
|
|
78 |
|
Penalty Threshold |
|
|
15 |
|
MIPS Category |
2022 Performance Category Points |
2022 Performance Category Weights |
2022 Composite Score |
|
Quality |
37/60 |
55% |
33.9 |
|
IA |
15/15 |
15% |
15 |
|
PI |
0/25 |
0% |
0 |
|
Cost |
20/30 |
30% |
20 |
|
Total MIPS Score |
|
|
68.9 |
|
Penalty Threshold |
|
|
75 |
Like our primary care practice referenced above, the radiology practice is earning approximately the same performance category points in 2022 as 2018. (Cost is an exception to this, as the number of points in the Cost category changes with the number of applicable measures for a practice. The Quality score drops as well, which we will be explained below, but the category weights also play a role.) However, the effect on the 2022 radiology practice’s final score is devastating in a way not experienced by the primary care practice. Reporting the same categories that earned 78% in 2018 earn only 68.9% in 2022. To avoid a negative payment in 2022, this practice will need to be exempted from PI and significantly improve their Quality score.
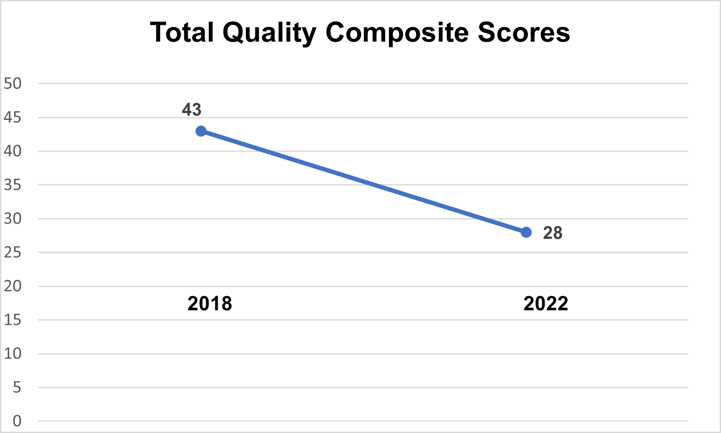
But why did the practice’s Quality score drop so dramatically? Let’s take a closer look at what measures this practice reported to CMS in 2018 and what measures they might report in 2022.
2018 Quality Composite Score |
||||
|
Measure # |
Quality Performance |
Measure Achievement Points |
Outcome/ High Priority Bonus Points |
2018 Total Points |
|
225 |
100% |
10 |
1 |
11 |
|
76 |
100% |
7 |
1 |
8 |
|
21 |
100% |
7 |
1 |
8 |
|
23 |
100% |
7 |
1 |
8 |
|
145 |
86.1% |
3 |
1 |
4 |
|
147 |
88.8% |
3 |
1 |
4 |
|
405 |
100% |
3 |
1 |
4 |
|
Total |
|
|
|
43 |
(In the table above, we’ve included all measures that earn points that contribute to the practice’s final Quality category score, whether those points are earned through measure achievement points or extra points from the outcome or high priority bonus points.)
2022 Quality Composite Score |
||||
|
Measure # |
Quality Performance |
Measure Achievement Points |
Outcome/ High Priority Bonus Points |
2022 Total Points |
|
405 |
100 |
10 |
1 |
11 |
|
76 |
100% |
7 |
1 |
8 |
|
436 |
98.20% |
3 |
0 |
3 |
|
145 |
86.1 |
2 (or 1) |
1 |
3 |
|
147 |
88.8 |
2 (or 1) |
1 |
3 |
|
406 |
100 |
0 |
0 |
0 |
|
Totals |
|
|
|
28 |

Our 2022 scenario has the radiology practice collecting data on the same available measures and achieving the same measure performance for all available measures as in 2018. However, the projected Quality points decrease by 16 points due to the removal of the three-point floor for measures with benchmarks (e.g. measures 145, 147), scoring 0 points for a measure without a benchmark (measure 406), and the removal of topped out measures on which the practice scored well (e.g., measures 21, 23, 195, and 225). While not factored in above, a practice could earn additional outcome/high priority or CERHT bonus points for measures reported beyond the top six. CMS has proposed to eliminate these bonus points as well. See a more complete explanation below:
2022 Proposed Changes to Quality Scoring
- Removal of the three-point floor for benchmarked measures with an updated scoring range to 1-10 points.
- Reduced scoring for measures without benchmarks from 3 points to 0 points, even if the data completeness criteria are met.
- Removal of outcome/ high priority and CEHRT bonus points for measures submitted beyond the top six.
Conclusion
We anticipate that the changes to MIPS requirements in the upcoming years will have a disproportionate effect on clinicians in non-patient-facing clinical settings, and specialty or clinical settings that are otherwise challenged with having few available Quality measures, measures without benchmarks, or topped out measures. A transition to MIPS Value Pathways (MVPs) or to QCDR measures may help these clinicians achieve more competitive MIPS scores. Regardless of specialty, it will be much more difficult for providers in any clinical setting to earn exceptional performance scores as they did in the early years of MIPS. The “easy-A” will be all but impossible to achieve. An attitude or strategy of “maintenance” will also not be enough to achieve outstanding performance, and for some practices, without significant effort or investment, will not be enough to avoid the payment adjustment. Whether your goal is to maximize your incentive, or simply to avoid the penalty, starting the reporting year without a solid plan to address these challenges will seriously cost you. MIPSpro and the Healthmonix team are here to help! Contact us today to start planning your strategy for MIPS success.

