In the ever-evolving healthcare world, staying current is vital. Orthopedic surgery, particularly arthroplasty, has been at the forefront of the shift toward value-based care models. With certain procedures already subject to bundled payments for over a decade, the integration of cost measures within the Merit-Based Incentive Payment System (MIPS) is a game-changer.
Read on as we unravel the vital details of this essential aspect of modern healthcare performance assessment.
-3.png?width=800&name=Untitled%20design%20(2)-3.png "Untitled design (2)-3")
Orthopedic surgery, specifically arthroplasty, was one of the first areas impacted by value-based care models. Specific procedures have had bundled payments for over 10 years.
The MIPS program includes similar cost measures. Starting with the 2022 performance year, the Cost category counts for 30 percent of the calculated MIPS score. With MIPS impacting provider Medicare payments ranging from a 9% penalty to an 8.25% incentive, there is renewed value in paying attention to MIPS cost measures.
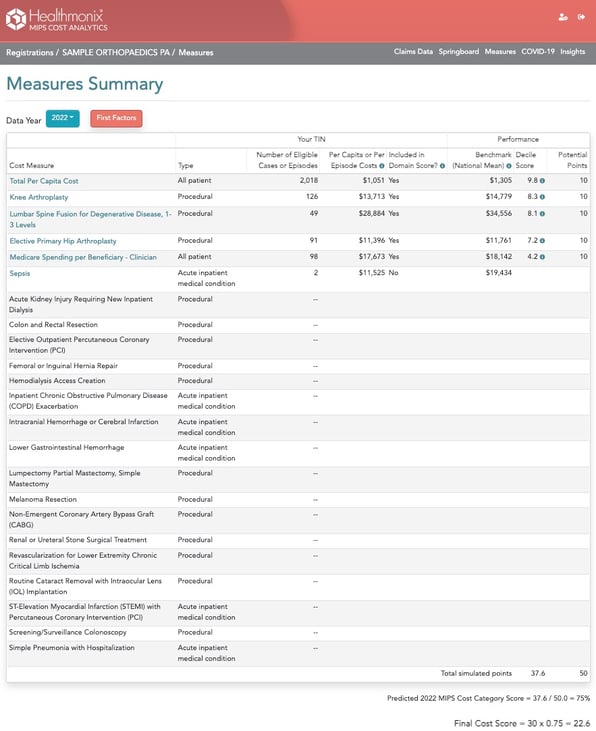
What does the MIPS Cost category measure?
The cost measures that impact orthopedic practices typically include:
- Knee Arthroplasty
- Elective Primary Hip Arthroplasty
- Lumbar Spine Fusion for Degenerative Disease, 1-3 Levels
- Medicare Spending Per Beneficiary Clinician
- Total Per Capita Cost**
For each procedural measure, CMS has identified the CPT codes billed to CMS to trigger inclusion in the Cost category. CMS evaluates the included episodes that are billed to Medicare and determines the attributed providers based on the procedure performed and the total cost.
Costs are included based on a window from before the procedure through the post-acute phase. All charges related to the procedure during that period are attributed to the episode, regardless of the provider who billed the service. Episodes are risk-adjusted and aggregated to determine a final risk-adjusted average episode cost for each provider. These are then scaled against all providers and bucketed into deciles for the year to arrive at a score.
Scores are relative to other providers of the same episodes of care
Each year, CMS reviews all the episodes related to each measure and determines the average risk-adjusted cost. All providers are then classified into deciles, where the highest-cost 10 percent of providers are in the lowest decile (receiving the lowest score). The next 10 percent are in decile 2, the next 10 percent are in decile 3 and so on.
As an example, here are the deciles that CMS calculated for Knee Arthroplasty for 2022:
-2.png?width=644&height=483&name=Add%20a%20subheading%20(3)-2.png)
Note that these costs include all services relevant to the episode, from 30 days before the procedure to 90 days after. This includes any inpatient care, after care, and therapy.
It’s striking that for each $400 change, or 3 percent, in the average cost of a practice’s episodes, the decile changes. That means a practice can increase its score by reducing its overall average episode cost by 3 percent.
These deciles are calculated into final Cost category scores and account for 30% of the total MIPS score beginning with the 2022 performance year final scores. This scoring will continue in 2023 and beyond.
How can a practice influence their score?
Data is king.
Digging into Knee Arthroplasty we find that only 10 percent of the average cost is billed by the provider group that is attributed the episode. The remainder can be summarized similar to the chart below.
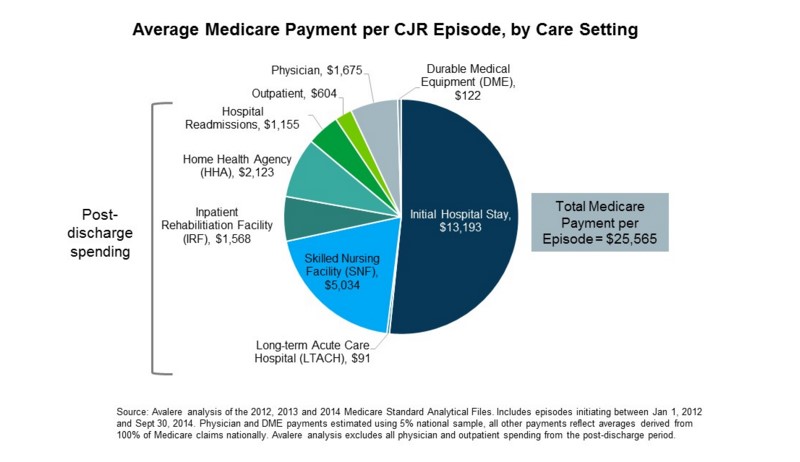
A practice or provider that is charged with these episodes can’t view this data via their claims or EMR. Therefore, it’s critical to have access to the total claims data for patients to do any analysis or impact the episode costs and resulting MIPS Cost category score.
Once that data is accessible and organized, it can be analyzed to determine where costs are occurring. Practices can then take steps to lower the total costs. This can be done without lowering revenue. In fact, it may result in higher revenue.
How can you improve?
First, we need to understand what goes into the cost.
Below is the typical episode, segmented into the included steps. These should look familiar.
-1.png?width=721&height=180&name=Add%20a%20subheading%20(1)-1.png)
Once the data is organized this way, analysis can be done to determine where costs above the norm are occurring. Then changes can be made to bring the cost in line with, or below, other providers.
-2.png?width=721&height=180&name=Add%20a%20subheading%20(2)-2.png)
There are several ways to attack this. The first step, having the full picture for episodes, is critical. That’s what Healthmonix puts in front of practices — full-episode data, including the ‘other 90 percent’, to facilitate complete analysis and work to better support patients.
Here are 3 approaches
- Give providers the data and let them compare and contrast their episodes. They'll often engage and point out where the variances occur and discuss how to optimize. We’ve found that performance changes and improvements occur best when providers are engaged in the root-cause analysis.
- Use support teams within practices to analyze the data and determine where the variances are occurring and develop changes.
- Work with Healthmonix to identify where the variances are occurring and develop changes and plan of action to institute in the practices.
Variance between providers in a practice
When analyzing the complete dataset for episodes, it frequently becomes apparent that there’s significant variability in costs among providers within the same practice. For instance, during our examination of 1 practice, we found that the average risk-adjusted cost for Knee Arthroplasty episodes was $17,199. However, upon closer inspection of individual providers, their respective averages ranged from $15,162 to $19,584.
This variance among providers within the same practice warrants further investigation and provides the opportunity to easily compare and contrast methods and services included. We can contrast the data pertaining to these providers to identify the causes of this disparity.
Subsequently, we can explore potential changes that could help align the higher-cost provider with their lower-cost counterparts.
What’s the next step?
Many provider groups have shrugged their shoulders at the MIPS Cost category, thinking there’s not much they can do. As highlighted earlier, however, possessing a comprehensive dataset and structuring it effectively can significantly contribute to facilitating changes that enhance not only MIPS Cost scores but also influence cost measurements within other value-based programs.
We believe we can help by presenting the data in a user-friendly format. This enables a deeper understanding of the entire dataset and the CMS-calculated scores.
Click here to schedule a MIPS Cost Analytics demo